Difference between revisions of "Monitoring and Management of Percona XtraDB"
| Line 106: | Line 106: | ||
Note: if your PMM server has a username and a password the command to use is | Note: if your PMM server has a username and a password the command to use is | ||
pmm-admin config --server pmm_server_IP --server-user username --server-password password | pmm-admin config --server pmm_server_IP --server-user username --server-password password | ||
| + | |||
| + | After we connect the pmm client to the pmm server if you access the pmm server dashboard, you will not see Data from db1 or see db1 itself | ||
| + | |||
| + | We need to enable data collection from db1 so it can show up on the pmm sever. | ||
| + | |||
| + | ==Data collection== | ||
| + | |||
| + | The metrics we need to see in the pmm server are: MYSQL metrics and MYSQL quuery analytics. To enable this, we run | ||
| + | |||
| + | pmm-admin add mysql --user root --password your_mysql_instance_password | ||
Revision as of 22:40, 9 May 2018
For this tutorial, we will install Percona Monitoring and Management server (PMM server) on a separate node and pmm-client on each database node
Prerequisites
We have three (3) different ways of running PMM server 1- Running PMM server via Docker 2- Running PMM server as a Virtual Appliance 3- Running PMM server Using AWS Marketplace
For the purpose of this tutorial, we we be running PMM server via Docker. So you will need node running Docker. I will not convert the installation of docker in this tutorial.
Getting the PMM server up and running
Download the percona/pmm-server image
Login to your docker node and run
docker images
output
root@docker2001:~# docker images
REPOSITORY          TAG                 IMAGE ID            CREATED             SIZE
nginx               latest              ae513a47849c        9 days ago          109MB
ubuntu              latest              0458a4468cbc        3 months ago        112MB
In my case I have only 2 images no percona/pmm-server image. Lets go ahead and download the percona/pmm-server image by issuing the command
docker pull percona/pmm-server:latest
Now if we run again the commande "docker images" we should see the percona/pmm-server image
Output
root@docker2001:~# docker images
REPOSITORY           TAG                 IMAGE ID            CREATED             SIZE
nginx                latest              ae513a47849c        9 days ago          109MB
percona/pmm-server   latest              62f64eeb6eec        2 weeks ago         842MB
ubuntu               latest              0458a4468cbc        3 months ago        112MB
Start the percona/pmm-server container
Now that we have the image available we are going to create the pmm-data container and start it using the scripts below
Script to create the container
#!/bin/bash
docker create \
  -v /opt/prometheus/data \
  -v /opt/consul-data \
  -v /var/lib/mysql \
  -v /var/lib/grafana \
  --name pmm-data \
  percona/pmm-server:latest /bin/true
Script to start the container
#!/bin/bash
docker run -d \
  -p 80:80 \
  --volumes-from pmm-data \
  --name pmm-server \
  --restart always \
  percona/pmm-server:latest
Please refer to Docker documentation for the different options used in both scripts such as -v, -p and so on
make both scripts executable my running
chmod +x pmm-data.sh
Chmod +x pmm-run.sh
Run both scripts
./pmm-data.sh
./pmm-run.sh
Now check the list of running containers
docker ps
Output
root@docker2001:~# docker ps
CONTAINER ID        IMAGE                COMMAND                CREATED             STATUS              PORTS                         NAMES
dfff2958b2b3        percona/pmm-server   "/opt/entrypoint.sh"   2 minutes ago       Up 2 minutes        0.0.0.0:80->80/tcp, 443/tcp   pmm-server
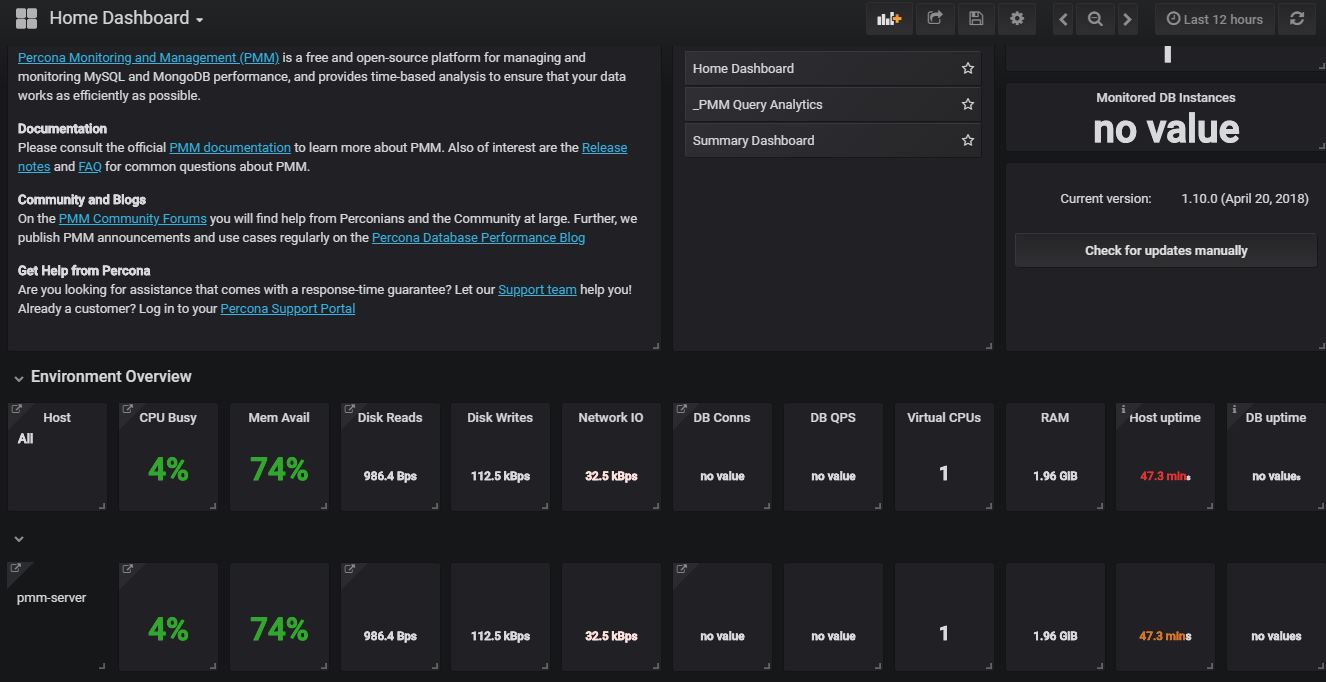
Open a browser and type in your IP address to access the pmm-server dashboard
Install Pmm-client on each node
We are going to use the same nodes we used in How to install Percona XtraDB Cluster. We have a total of 3 nodes (db1,db2 and db3)
Process is the same, so I will be doing the first node (db1)
login to db1, run
sudo apt-get update
sudo apt-get install pmm-client
Connect PMM client to PMM server
To connect each pmm client to PMM server we use the command "pmm-admin config --server IP_adress_of_server" in our case the command will be
pmm-admin config --server 10.192.0.96
OK, PMM server is alive.
PMM Server      | 10.192.0.96
Client Name     | db1
Client Address  | 10.192.0.87
10.192.0.96 being our PMM server IP addres
Note: if your PMM server has a username and a password the command to use is
pmm-admin config --server pmm_server_IP --server-user username --server-password password
After we connect the pmm client to the pmm server if you access the pmm server dashboard, you will not see Data from db1 or see db1 itself
We need to enable data collection from db1 so it can show up on the pmm sever.
Data collection
The metrics we need to see in the pmm server are: MYSQL metrics and MYSQL quuery analytics. To enable this, we run
pmm-admin add mysql --user root --password your_mysql_instance_password
